
Bolivia · Informational guide
Slots RTP and volatility: what the numbers mean in Bolivia
Slots RTP and volatility describe mathematical features of payouts, but they do not predict a session’s result. For a reader in Bolivia, seeing 96% beside a balance in bolivianos does not mean Bs 96 will be returned from every Bs 100 deposited. The percentage needs a denominator, a model and context. The hypothetical examples below separate those ideas without describing a real casino or recommending a way to gamble.
In this guide
What RTP measures and what it leaves unanswered
RTP means return to player. In a theoretical model, it expresses the expected relationship between payouts and money wagered under specified rules. The Gambling Commission explains that the percentage concerns an average across many plays, not a reimbursement that must occur within each session. It is cited here as a British technical source, not as the authority setting Bolivian gambling requirements. Read its explanation of return to player.
The question answered is how much is paid on average relative to wagering turnover within the model. RTP does not say when a payment will arrive, who will receive it or what balance a person will have when they finish. It also does not give the proportion of users who finish with a profit. Confusing any of those questions with RTP changes the meaning of the statistic even if its numerical value is copied accurately.
Consider an illustrative model with a 96% return. For each unit staked, the expected payment is 0.96 units. The difference of 0.04 is an expected loss within that model, not a fixed invoice for each outcome. An individual observation can be very different. The educational value lies in understanding the gap between expectation and realisation, rather than turning an average into a personal promise of reimbursement or a timetable for payments.
Deposits, turnover, payouts and balances
A deposit is money entering an account. Wagering turnover adds up the amounts staked. Payouts are amounts returned by game results according to the rules. A balance is what remains at a particular time, also affected by other account movements or conditions. These quantities can be related, but they are not interchangeable. Clear definitions are necessary before a percentage calculated from them can be interpreted sensibly.
A fictional accounting example requires no play. An account starts with Bs 100. It records Bs 20 in stakes and Bs 12 in payouts, leaving Bs 92. It then records Bs 30 in stakes and Bs 15 in payouts, leaving Bs 77. Total turnover is Bs 50, total payouts are Bs 27, and the net gaming result is minus Bs 23. The arithmetic describes the invented ledger, not an operator’s terms or a real person’s account.
Payouts divided by turnover in that ledger equal 54%. That does not establish the theoretical RTP of a game; it describes only the recorded operations. Dividing the final Bs 77 balance by the starting Bs 100 answers a different question: how much of the original balance remains. Someone who interchanges these calculations can publish two different percentages while calling both RTP. Always identify what was added in the numerator and denominator before evaluating the claim.
Calculate observed return from the relevant totals
Observed return is total payouts divided by total wagering turnover, multiplied by one hundred. It describes a sample and does not automatically demonstrate that a product complies with or departs from its design. The Gambling Commission’s monitoring guidance connects evaluation with volume, volatility and statistical tolerances. See the technical guide to monitoring RTP.
Imagine a fictional worksheet with Bs 12,000 of turnover and Bs 11,400 of payouts. Its observed return is 95%. A second worksheet records Bs 2,000 of turnover and Bs 2,600 of payouts, giving 130%. The second figure does not make the underlying game a guaranteed source of profit. A limited set of outcomes can produce payments above the amount staked while the theoretical model still has an expectation below one hundred percent.
To combine these worksheets, first add their payouts and turnover. There are Bs 14,000 of payouts against Bs 14,000 of turnover, producing 100%. Taking the simple average of 95% and 130% would give 112.5%, which is wrong for the combined ledger because the monetary sample sizes differ. This is an independently checkable arithmetic example. It is not evidence about actual player results, the fairness of a platform or the likelihood of recovering money.
The same mean can describe very different distributions
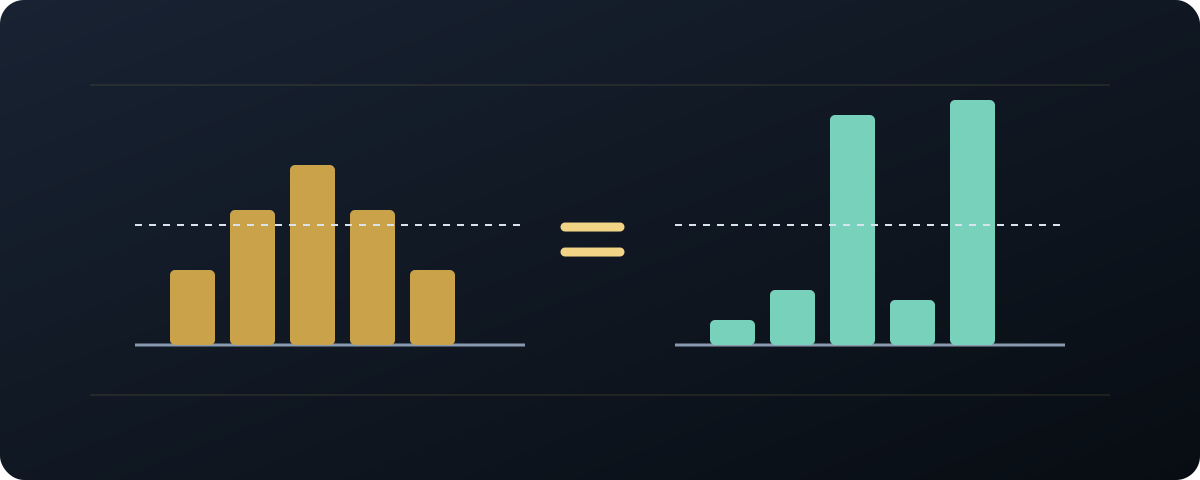
An average summarises a distribution, but many distributions can share that average. Consider two imaginary experiments with one hundred equally probable possible outcomes. In the first, ninety-six outcomes pay one unit and four pay nothing. In the second, one outcome pays ninety-six units and the other ninety-nine pay nothing. The average payment is 0.96 units in both experiments, even though the possible individual experiences differ considerably.
In the first experiment, small payments occur frequently. In the second, almost every possible outcome pays zero and a large payment is rare. Neither experiment represents a particular slot, and they are not proposed options for gambling. Their function is to show that knowing the mean leaves much of the distribution undescribed. A sentence about an average cannot silently supply information about payment size, frequency or the result a particular individual will experience.
A list of possible outcomes is also not an obligatory sequence. The example does not say that one hundred observations must contain each possibility exactly once. If outcomes are selected independently, some can repeat while others never appear in that sample. The existence of an outcome within a model does not specify when a person will see it or establish that they ever will. Confusing possibilities with a scheduled sequence is another way to misread the average.
Volatility describes dispersion, not a prize calendar
Volatility describes how widely results can vary around their mean. Standard deviation is a related statistical measure. Labels such as low, medium and high are summaries, not necessarily a universal scale used identically by every provider. Without a common definition, equal labels do not establish equal distributions. A simple descriptive label therefore needs context before it can support a comparison between different sources or products.
The two imaginary experiments explain the distinction without advanced formulas. The first concentrates payments near one unit; the second separates one large payment from many zeros. The second has greater dispersion. That does not mean someone can select the moment at which its large outcome appears. Dispersion concerns the set of possible results. It is not a clock that indicates when a particular sequence of losses will end.
A statement such as high volatility, therefore a prize is close joins unrelated ideas. Even if the first part were documented, it would not support the second. Likewise, a low-volatility label does not guarantee preservation of a balance or eliminate negative outcomes. The information helps explain uncertainty rather than removing it. Reading it correctly requires resisting the temptation to translate a property of a model into a prediction about the very next result.
Payment frequency is not profit frequency
Payment frequency concerns how often an outcome produces a payout under a particular definition. Net profit compares that payment with the corresponding stake. An outcome can include money being returned and still represent a net loss. Words such as hit, prize, payment, return and win therefore need definitions. A persuasive description can otherwise count any positive payment while encouraging readers to hear the stronger claim that the operation produced a profit.
Suppose a fictional operation costs Bs 10 and returns Bs 4. A payment of Bs 4 occurred, but the net result is minus Bs 6. A report can consistently count it as an outcome with a payment if that is its stated definition. It would be misleading to describe the person as having made a Bs 4 profit without accounting for the cost. An animation or celebratory sound does not change the arithmetic.
When reading a frequency statistic, ask whether it includes payments below the stake, payments equal to the stake and special features. It also matters how a round containing several events is counted. Without these details, comparing percentages can create an apparent difference that comes from definitions alone. The issue is interpretation of metrics, not a signal to select a game, increase attempts or search for a supposedly favourable point in a sequence.
Keep each metric attached to its own question
The table below separates concepts that are often mixed in articles, videos and promotional descriptions. None of these measures, considered alone, predicts an individual profit. Each has a limited question it can answer and several conclusions it cannot support.
| Concept | Question answered | Conclusion it does not establish |
|---|---|---|
| Theoretical RTP | Expected return within the defined model | How much of your deposit will come back |
| Observed RTP | Relationship between payouts and turnover in a sample | Whether the next outcome compensates previous results |
| Volatility | Dispersion of the possible results | When a large payment will arrive |
| Payment frequency | Proportion of outcomes producing a defined payment | Proportion of people who finish in profit |
| Maximum payment | An upper outcome described in the rules | That it is frequent or will occur in a session |
| Final balance | Amount remaining after recorded movements | The theoretical return of the underlying product |
A good explanation preserves these distinctions even when using everyday language. If a page gives a percentage without identifying which question it answers, there is no need to guess. Ask for its denominator, period and definition. A precisely calculated number loses usefulness when attached to a question it was never designed to answer. Clarity comes from defining the measurement, not merely displaying more decimal places beside it.
Independence and the feeling that an outcome is due
In a model with independent outcomes, previous results do not change the probability of the next outcome. Independence must actually be an assumption of the model. It should not be extended without checking to every machine, mode or feature, because systems can have different states or mechanics. A mathematical conclusion should follow a stated assumption, not a general impression that everything described as random must operate in exactly the same way.
Under the independence assumption, a sequence of losses does not create a debt that the system must repay to the individual. A sequence of payments also does not establish that more will follow. Looking for patterns is understandable, but a feeling does not change probabilities. A record describes past events; turning it into a prediction would require an appropriate model and evidence supporting that prediction. A colourful history display supplies neither automatically.
Imagine independent tosses of a balanced coin. After several identical results, the next result retains the same probability under the stated assumptions. The example does not equate a casino with a coin or offer a betting method. It isolates an error in reasoning: giving compensating memory to a process defined without it. Explanations of chance need to distinguish an actual system rule from an intuitive story a person tells about the sequence they observed.
More observations do not guarantee recovery
Convergence of averages does not mean an individual should continue until compensation arrives. A larger sample can stabilise a proportion while accumulating a greater absolute monetary loss. The difference between relative variation and an absolute amount matters whenever someone invokes the long term without explaining the quantity being measured. A percentage becoming less variable is not the same thing as a balance becoming protected or a past loss being repaid.
In a hypothetical model with an expected loss of 4% of turnover, Bs 1,000 of turnover corresponds to an expected loss of Bs 40, while Bs 10,000 corresponds to Bs 400. Neither amount predicts an individual’s eventual result. The calculation shows that increasing turnover does not turn a negative expectation into a positive one. Statistical stability of a ratio is a different concept from receiving a particular amount of money back.
An explanation that ends by telling people to play more to reach the RTP misuses the mathematical idea. Continuing creates additional exposure or repeatedly exposes the remaining balance; it does not activate a right to recover losses. RTP contains no number of plays that guarantees breaking even. A decision to stop does not need to be justified by a previous outcome, a round number of observations or the belief that enough data has finally been collected.
What a sample can and cannot demonstrate
A sample can show what happened within its boundaries. Evaluating a model also requires its size, data definitions, rules and an appropriate statistical method. A percentage calculated from a screenshot or one evening cannot diagnose a system on its own. A favourable result does not prove correct implementation either. The strength of a conclusion depends on the design of the analysis and the evidence available, not on how striking an isolated observation appears.
Selection can distort the impression. If someone publishes only their best outcomes, the remaining observations are missing. If a video starts after earlier operations, the prior balance and total turnover are unknown. Several accounts sharing one screenshot do not create several independent observations. Before interpreting a collection of testimonials, ask how the material was chosen and what was excluded. A large visible collection can still represent a narrow and selectively presented part of the underlying activity.
Even with complete data, a deviation from a mean can have different explanations: ordinary variation, a recording error, a changed definition or a problem requiring investigation. A serious analysis does not jump straight to the most dramatic explanation. It describes the discrepancy, checks assumptions and identifies additional evidence needed. This protects against both unsupported allegations and overly reassuring commercial statements. Uncertainty should be explained as part of the analysis rather than treated as an inconvenience to conceal.
Published numbers need a version and a definition
A percentage has meaning only in relation to the product and rules it describes. A similar name or identical illustration does not establish that two references concern the same configuration. When reading technical material, preserve the exact title, identified provider, version if available and source of the number. If those details are absent, keep the limitation attached to the percentage rather than quietly supplying a likely interpretation from another page.
A base game and separately described features may also have different definitions. Do not add percentages or apply one feature’s figure to the whole without knowing how it was calculated. A statement using up to describes a limit on the claim, not necessarily the value of every implementation. This article does not publish RTP figures for commercial titles because their particular configurations for readers in Bolivia were not verified in this review.
A visual demonstration or test mode does not certify future results either. It may provide an interface to observe, but a short run cannot identify the complete model. Written examples are sufficient for the arithmetic in this guide. There is no need to open a game or place a wager to understand it. The quality of a mathematical explanation depends on definitions, assumptions and calculations, not a screenshot of an unusually favourable session.
Bolivianos, currency conversion and outside costs
Using Bs makes examples easier to relate to locally, but changing a unit of currency does not itself change a mathematical proportion. If all relevant amounts are converted using the same factor, the ratio of payouts to turnover stays the same. Actual fees or differing conversion conditions can affect the money available, but those belong to the accounting of the transaction and need to be identified separately from the game model.
Imagine a worksheet showing Bs 100 of turnover and Bs 96 of payouts. Multiplying both figures by the same conversion factor still produces a 96% ratio. If an external fee is then deducted, the final balance changes, but that does not demonstrate a change in the game’s mathematical model. Combining these layers makes it harder to identify the source of a difference. Keep game results, account movements and outside costs in distinct fields.
No current exchange rates or bank tariffs are used here because the article explains relationships rather than comparing payment services. A real cost figure would need a date, provider, origin and destination currency, and all relevant charges. Precision begins with preserving units. Writing one hundred without specifying bolivianos, credits, dollars or promotional points can invalidate a comparison even when every multiplication in the calculation is performed correctly.
Examine a promise built around a percentage
First identify the exact promise. If it says you will recover 96%, ask whether it concerns modelled payouts relative to turnover or a personal deposit. If it says nine out of ten outcomes pay, ask what counts as a payment and whether that implies a positive net result. If it promises a prize after a sequence, look for the rule supporting that guarantee. A chart of past outcomes does not establish it.
Then inspect the source. A percentage can be accurately copied and incorrectly applied. The version may be missing, or observed data may have been confused with a theoretical value. A useful response is not to search for a higher number elsewhere; it is to establish what the number already being used actually means. When a claim cannot be traced to a clear definition, the honest result is to leave it unverified.
Finally, separate mathematics from authorisation. Formulas or technical certificates do not by themselves answer a service’s regulatory position in Bolivia. The guide to AJ licence claims addresses that issue. If a supposed expert asks for identity documents or passwords to reveal a secret percentage, consult the privacy guide. Understanding probability does not require handing sensitive information to an intermediary who claims to know which outcomes are about to occur.
Explain the concept clearly to another person
A complete explanation can be short: this percentage describes a model average over money wagered; it does not guarantee a balance or next result; interpreting an observed number requires rules, definitions and a sample. That wording retains the essential meaning without promises or unnecessary jargon. When adding an example, use hypothetical amounts and state that they are not verified figures from a particular operator or a prediction for a reader’s account.
If the conversation begins with a loss, do not turn the statistical explanation into an invitation to experiment. Money does not need to be risked to examine an average on paper. When someone feels pressure to recover losses, discussing additional percentages may not address the immediate concern. The responsible gaming resources provide information about limits and support separately from the mathematical discussion. Different needs deserve different responses rather than more claims about the next result.
Understanding RTP does not eliminate chance or turn gambling into an investment. Its educational value is recognising what is known and what remains uncertain. Careful reading reveals changing denominators, confusion between payments and profit, and misleading uses of the long term. Those tools help assess statements more clearly even when the eventual decision is to close the page and take no further part. No mathematical demonstration here requires a real-money transaction.
A final arithmetic check without a gambling experiment
To review a calculation, use an invented ledger and label every column. Start with an opening balance, record stakes and payouts separately, and calculate the closing balance without inserting deposits into the turnover column. Confirm that opening balance minus stakes plus payouts matches the result when there are no other movements. If the equality fails, investigate the missing movement or arithmetic before interpreting a return percentage.
Next compare the ratio calculated from totals with any average of smaller ratios. The two are generally not interchangeable when the denominators differ. Finally, state what the calculation describes: this ledger, this sample and these assumptions. It does not identify the next outcome or establish the return of a commercial product. This simple paper exercise checks the logic of an explanation while keeping the educational task entirely separate from participation in gambling.
Frequently asked questions
Does 96% RTP mean Bs 96 will return from a Bs 100 deposit?
No. Theoretical RTP concerns expected payouts relative to wagering turnover within a model. A deposit is a different quantity, and the percentage does not guarantee an individual result or reimbursement of a balance.
Can observed RTP exceed 100%?
Yes. Payouts can exceed recorded turnover within a sample. That describes those results and does not establish a permanently positive expectation. Interpreting the sample requires its boundaries, definitions and rules.
Does high volatility mean a payment is approaching?
No. Volatility describes dispersion, not a timetable. A volatility label cannot predict the next payment or ensure that a particular person will observe a large outcome.
Does continuing force a system to compensate losses?
No. Theoretical return does not create a debt to each person. In an independent-outcome model, history does not change the next probability, and greater turnover does not turn a negative expectation into a positive one.